Data Analysis
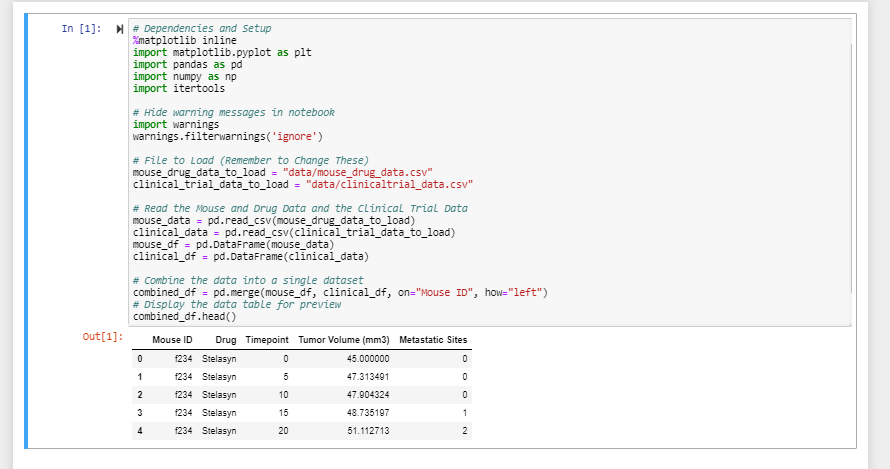
Sorting through large amounts of data for pharmaceutical trials becomes a breeze when the right tools are used. With the use of Python, Pandas, Matplotlib, and Numpy I combined two large CSV files and was able to run an analysis of which drugs proved to be most successful against squamous cell carcinoma.
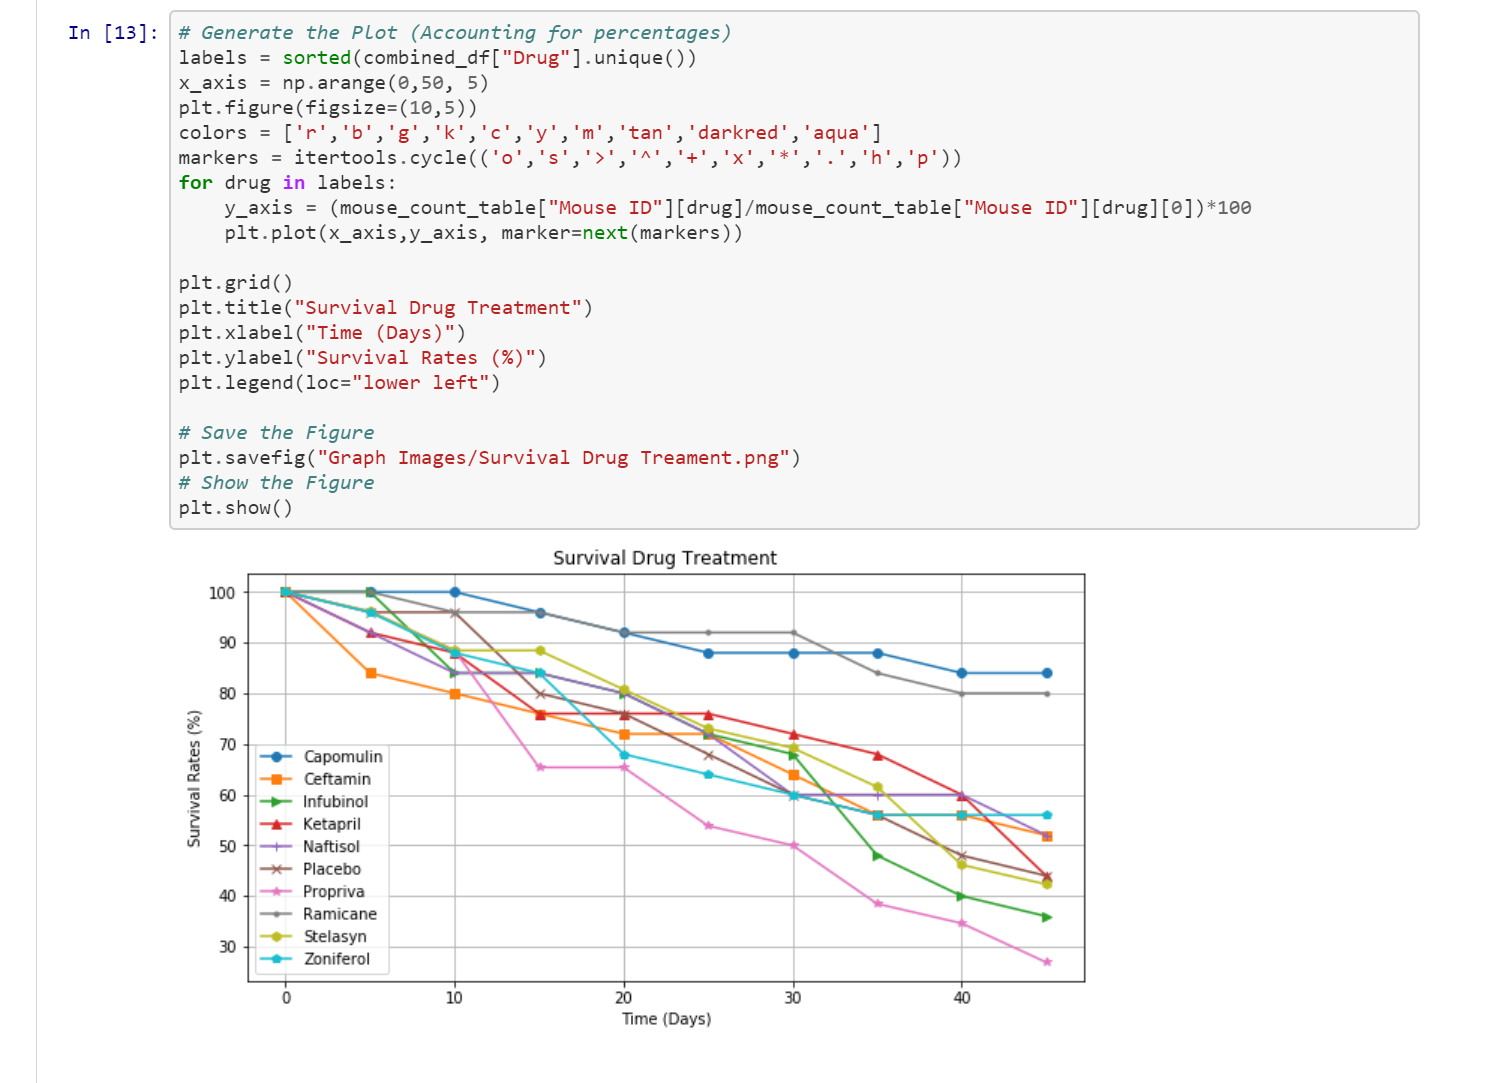
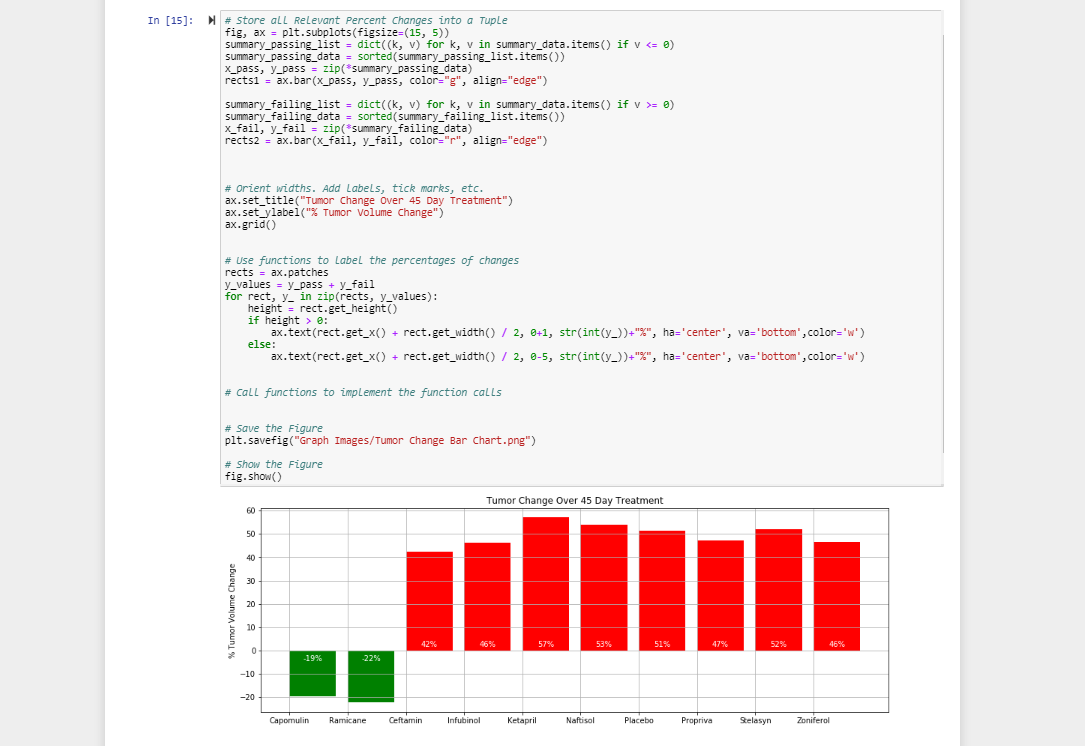
A total of 9 drugs were tested against a placebo, of which two showed decreased mortality over 45 days as well as decreased tumor size. It was easy to see which drugs proved most successful when the data was quickly placed in a series of graphs and a bar chart
Please click here to view the Jupyter Notebook on GitHub